
Highlights
- Gold to silver ratio measures relative value, not just price direction. Ratio above 80 often signals silver undervaluation, while ratio below 45 often signals silver overperformance and potential gold opportunity.
- High ratio environments usually appear during economic fear, recession risk, or financial instability. Gold attracts defensive capital first, and silver lags temporarily.
- Low ratio environments usually appear during strong commodity bull markets. Industrial demand and speculative enthusiasm often push silver higher than gold.
- Strategic investors rotate between metals instead of predicting absolute tops or bottoms. Rotation strategy reduces emotional decision making.
- Gradual allocation shifts work better than all in moves. Scaling into positions protects capital while allowing participation in mean reversion cycles.
- Inflation, monetary policy, real interest rates, and currency strength all influence ratio movements. Macro awareness improves timing quality.
- Silver offers higher volatility and higher upside potential. Gold offers stability and defensive strength during crises.
- Long term outlook supports continued cyclical behavior rather than permanent extreme ratios.
Introduction
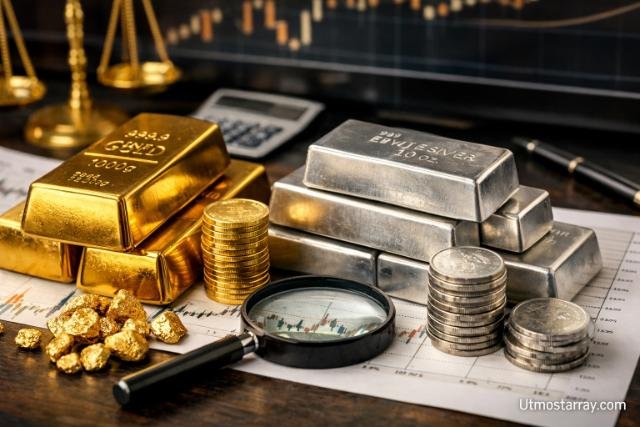
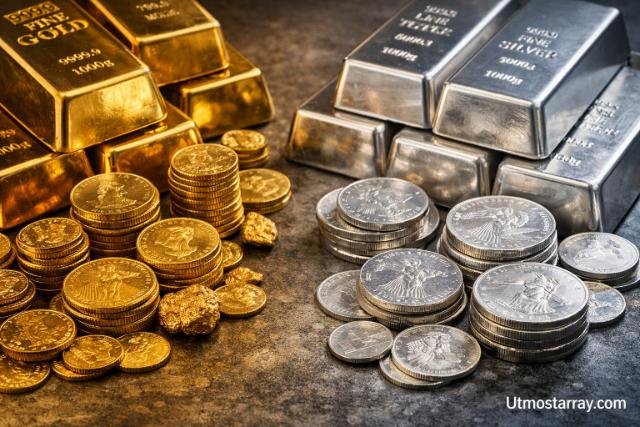
Gold to silver ratio when to buy depends on historical valuation ranges, macroeconomic cycles, inflation expectations, and investor sentiment toward precious metals. Gold to silver ratio measures how many ounces of silver equal the price of one ounce of gold. Investors monitor that ratio because extreme highs often signal silver undervaluation, while extreme lows often indicate silver overvaluation relative to gold. Strategic buying decisions rely on understanding economic context, monetary policy, and long term market behavior.
What Is the Gold to Silver Ratio and Why Does It Matter?
Gold to silver ratio represents the number of silver ounces required to purchase one ounce of gold. Ratio calculation follows a simple formula: Gold price divided by silver price equals the ratio value. For example, if gold trades at $2,000 and silver trades at $25, the ratio equals 80.
Ratio value reflects relative pricing rather than absolute pricing. Relative pricing gives investors a valuation signal. High ratio values suggest silver trades cheaply compared to gold. Low ratio values suggest silver trades expensively compared to gold. That signal helps investors rotate between metals rather than guessing market tops or bottoms.
When I first began studying precious metals, I ignored ratio data and focused only on gold price headlines. Experience taught me that ratio extremes often create better opportunities than short term news events. Watching the ratio instead of chasing emotion improved my discipline and reduced impulsive buying decisions.
Historical Average Levels
Historical average ratio levels typically range between 50 and 70 during modern fiat currency periods. Long term data shows extreme spikes above 80 during financial stress events and drops below 40 during precious metal bull markets. Those ranges help investors identify statistical outliers rather than normal fluctuations.
Why Investors Monitor the Ratio
Investors monitor the ratio because ratio expansion and contraction cycles repeat across decades. Ratio expansion usually occurs during economic uncertainty when investors favor gold’s stability. Ratio contraction usually occurs during strong commodity cycles when silver’s industrial demand accelerates. Understanding those cycles allows you to position capital strategically.
When Is the Gold to Silver Ratio Considered High?
High ratio conditions typically occur above 75 to 80 in modern markets. Ratio above 80 historically indicates silver undervaluation relative to gold. Undervaluation creates accumulation opportunities for investors who expect mean reversion.
Economic stress environments often push ratio levels higher. Financial crises, banking instability, and recession fears drive capital into gold as a safe haven. Safe haven demand strengthens gold price performance compared to silver, which has higher industrial exposure. That divergence expands the ratio.
During 2020 market panic, ratio levels briefly exceeded 120. Such extreme conditions historically precede strong silver rallies. When I saw that spike, I increased my silver allocation gradually instead of trying to perfectly time the bottom. Gradual accumulation helped reduce risk while positioning for recovery.
Macroeconomic Fear Signals
Macroeconomic fear signals include stock market crashes, rising unemployment data, and tightening credit conditions. Fear increases gold demand faster than silver demand. Fear-driven buying pushes ratio upward because gold absorbs more capital inflow than silver.
Silver Undervaluation Opportunity
Silver undervaluation opportunity appears when industrial demand remains stable but investment demand temporarily weakens. Investors who understand historical reversion patterns often accumulate silver during these phases. Patience becomes the key advantage during undervaluation periods.
When Is the Gold to Silver Ratio Considered Low?
Low ratio conditions typically occur below 50. Ratio below 40 often signals silver overperformance relative to gold. Overperformance suggests late stage commodity momentum rather than early accumulation opportunity.
Commodity bull markets usually compress the ratio. Strong global growth increases industrial demand for silver in electronics, solar panels, and manufacturing. Industrial acceleration boosts silver price faster than gold price. That acceleration narrows the ratio.
I learned that buying silver aggressively when the ratio falls below 45 often carries more downside risk. Momentum may continue short term, but long term mean reversion probability increases. At low ratio levels, I personally shift some holdings from silver into gold to rebalance risk exposure.
Industrial Demand Acceleration
Industrial demand acceleration increases silver consumption in renewable energy and technology sectors. Manufacturing growth boosts silver usage while gold demand remains primarily monetary. Demand imbalance reduces the ratio.
Bull Market Euphoria
Bull market euphoria encourages speculative inflows into silver because silver typically shows higher percentage gains. Speculative enthusiasm compresses the ratio quickly. Investors must recognize emotional excess during such phases.
How Can You Use the Gold to Silver Ratio to Decide When to Buy?
Strategic buying decisions use ratio bands instead of fixed numbers. Ratio above 80 may signal silver accumulation. Ratio between 60 and 70 may suggest balanced allocation. Ratio below 45 may signal gold accumulation.
Portfolio rotation approach reduces timing pressure. Instead of predicting price direction, you adjust holdings based on relative value. If you already hold gold and ratio rises significantly, consider converting some gold into silver. If you hold silver and ratio drops sharply, consider converting some silver into gold.
My personal rule follows gradual scaling rather than all in decisions. I never move 100 percent of holdings at once. Scaling strategy protects against extended trends while allowing participation in mean reversion.
Ratio Band Strategy
Ratio band strategy divides valuation into zones. Extreme zone triggers stronger allocation shift. Neutral zone maintains current allocation. Structured bands reduce emotional trading and improve consistency.
Dollar Cost Averaging with Ratio Filter
Dollar cost averaging combined with ratio thresholds adds discipline. Regular purchases continue, but allocation percentage shifts based on ratio level. That hybrid strategy balances consistency with valuation awareness.
What Are the Advantages and Risks of Using the Ratio Strategy?
Ratio strategy advantages include objective valuation framework, historical mean reversion evidence, and diversification benefits. Relative valuation reduces emotional decision making. Historical cycles support probability based decision making.
Risks include structural economic changes and prolonged trend persistence. Monetary policy shifts, industrial transformation, and new supply dynamics may alter historical ranges. Ratio can remain elevated or depressed for extended periods.
In my experience, ratio strategy works best for long term investors who avoid leverage. Short term traders may struggle with patience because mean reversion timing remains unpredictable. Patience and capital management define success more than perfect timing.
Advantages of Relative Value Investing
Relative value investing focuses on comparison rather than prediction. Comparison reduces forecasting pressure. Investors gain flexibility because both metals serve as stores of value with different volatility profiles.
Risks of Overreliance on Historical Data
Historical data does not guarantee future performance. Structural shifts in mining supply, green energy demand, or central bank behavior can change ratio dynamics. Investors must combine ratio analysis with broader economic awareness.
How Does Inflation and Monetary Policy Influence the Ratio?
Inflation expectations influence both metals but impact strength differs. Gold often responds strongly to currency debasement fears. Silver responds to both inflation hedging demand and industrial growth expectations.
Loose monetary policy increases liquidity. Liquidity supports commodity prices broadly. Early stage monetary easing may favor gold. Later stage economic expansion may favor silver as manufacturing rebounds.
I pay attention to central bank rate decisions, bond yields, and money supply growth. Rising real yields often pressure gold more than silver short term. Falling real yields usually strengthen gold first, then silver follows if economic activity expands.
Real Interest Rates
Real interest rates measure nominal rates minus inflation. Negative real rates support precious metals because opportunity cost decreases. Gold typically reacts immediately, while silver reaction depends on industrial outlook.
Currency Strength
Currency strength affects precious metals pricing globally. Strong dollar environment may suppress silver more aggressively than gold. Dollar weakness often compresses the ratio as commodities rise together.
What Is the Long Term Outlook for the Gold to Silver Ratio?
Long term outlook suggests continued cyclical behavior rather than permanent extremes. Monetary uncertainty, rising sovereign debt, and renewable energy expansion create supportive conditions for both metals. Silver industrial demand growth may structurally reduce average ratio over decades.
Technological expansion increases silver usage in solar panels and electronics. Green energy policies support long term consumption. Gold maintains monetary reserve role and central bank demand. Dual demand structure creates ongoing rotation opportunities.
From my experience speaking with other investors and observing multiple cycles, disciplined ratio tracking builds confidence. Confidence replaces fear because you operate from a structured framework. Framework gives you clarity about when to buy silver aggressively and when to lean toward gold defensively.
Renewable Energy Demand
Renewable energy infrastructure requires significant silver input for photovoltaic cells. Solar adoption growth may increase baseline silver demand. Structural demand increase could compress long term ratio averages.
Central Bank Gold Accumulation
Central banks continue accumulating gold as reserve diversification strategy. Reserve demand strengthens gold price floor. Strong gold demand may prevent ratio from collapsing too far during silver bull markets.
Gold to Silver Ratio Historical Range Overview
| Ratio Level | Market Interpretation | Potential Action |
| Above 80 | Silver undervalued | Consider buying silver |
| 60 to 70 | Fair valuation | Maintain balance |
| 45 to 55 | Silver strong | Gradual rebalancing |
| Below 40 | Silver overvalued | Consider buying gold |
Practical Allocation Example
| Investor Profile | High Ratio Allocation | Neutral Ratio Allocation | Low Ratio Allocation |
| Conservative | 60% silver 40% gold | 50% silver 50% gold | 40% silver 60% gold |
| Balanced | 70% silver 30% gold | 50% silver 50% gold | 35% silver 65% gold |
| Aggressive | 80% silver 20% gold | 60% silver 40% gold | 30% silver 70% gold |
Conclusion
Gold to silver ratio when to buy depends on valuation extremes, macroeconomic cycles, inflation expectations, and disciplined portfolio management. High ratio levels often signal silver opportunity. Low ratio levels often signal gold opportunity. Strategic rotation between metals reduces emotional trading and improves long term consistency.
FAQ’s
What is a good gold to silver ratio to buy silver?
Ratio above 75 to 80 historically signals silver undervaluation. Investors often begin accumulation in that range rather than waiting for extreme spikes.
Can the ratio stay high for years?
Yes. Extended economic uncertainty or strong gold demand can keep ratio elevated for prolonged periods. Patience and gradual accumulation reduce timing stress.
Should beginners use the ratio strategy?
Beginners can use ratio strategy if they understand long term investing principles and avoid leverage. Education and discipline remain essential.
Does mining supply affect the ratio?
Mining output changes influence pricing over time. Supply constraints in silver or gold can alter historical ranges.
Is silver riskier than gold?
Silver volatility exceeds gold volatility because silver carries industrial exposure. Higher volatility creates larger percentage swings in both directions.